Calculator 1
The practical significance of achievement gaps is difficult to grasp, when group mean differences are expressed in original test scores (as measured by scale score differences) or in standard deviation units. Given that the pace of academic growth gets slower and slower at the higher ages/grades, what are the implications of such diminishing growth rates for any intervention efforts to reduce achievement gaps? We can translate the gaps in school year units using information on annual academic growth rates.
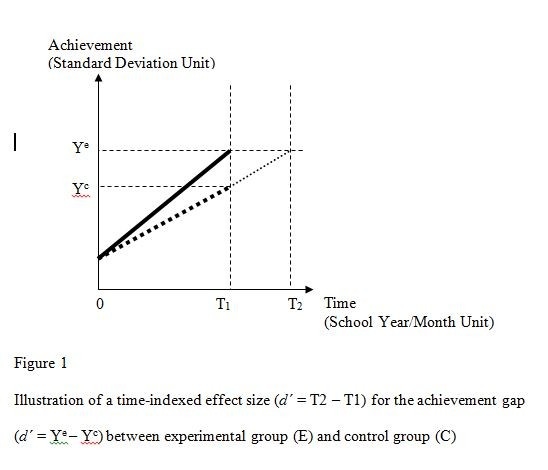
In an experimental or quasi-experimental research design using both a pretest and a posttest, academic growth between the two time points is estimated using the control group gain as the basis of a time-indexed effect size calculation. Figure 1 illustrates the concept and measurement of time-indexed effect size based on hypothetical linear patterns of growth for an experimental group (E) and a control group (C). Assuming that both groups have the same average pretest scores, Ye and Yc represent the average posttest scores of the achievement variable Y for the experimental group and control group respectively.
Unlike a conventional effect size metric such as Cohen's d that measures the group difference on the vertical axis (achievement variable in standard deviation units), we shift the focus of measurement to the horizontal axis (time variable in school year/month units). The time-indexed effect size (d΄) is the extra time (in school years/months) needed for the control group to reach Ye, the level of outcome that the experimental group has reached at the end of treatment (see Figure 1 below).
d΄ = T2 – T1
Where...
T2 = time needed for the control group to reach Ye;
T1 = time spent for the experimental group to reach Ye or for the control group to reach Yc
This notion of time-indexed effect size analysis can be extended to nonexperimental/observational research where preexisting group differences in achievement are measured. For example, the national average achievement gap between White and Black students in grade 4 math is about .9 in standard deviation units (i.e., 90% of a standard deviation). This difference is deemed large by Cohen's effect size benchmarks (.2 for small, .5 for medium and .8 for large). What does this statistical interpretation mean to educators in practical school terms? How long would it take for Black students to catch up to the current performance level of White peers? If we evaluate the achievement gap from the viewpoint of “time needed to catch up”, we need to know the average Black student’s annual growth rate first. Since the average math achievement growth rate is estimated to be 0.7 standard deviation units for fourth grade Black students, the White-Black gap of d = 0.9 is worth about 1 year and 3 months of schooling time; d΄ = 0.9 divided by 0.7 = 1.3. The calculator below allows you to convert Cohen's d (standardized group mean differences) into d΄ (years/months of schooling, i.e., time-indexed effect size) for any type of achievement gap at any grade in reading and math.
Time-indexed Effect Size for P-12 Reading and Math Research/Evaluation
Research Team
- PI: Jaekyung Lee (Professor of Education, University at Buffalo)
- Co-PI: Jeremy Finn (Professor of Education, University at Buffalo)
Abstract
The purposes of this IES-funded research project are (a) to develop academic growth references for P-12 reading and math achievement based on nationally-representative longitudinal datasets; and (b) to develop a time-indexed effect size metric, based on new national norms, that can be used to assess the effectiveness of educational interventions. Conventional effect size metrics such as Cohen’s d are standardized group mean differences based on the distributions of student outcome variables at one particular age or grade level. They do not take into account time dimension, that is, time needed to learn at that age/grade level. This study is based on the premise that time-indexed effect size metrics can estimate how long it would take for an “untreated” control group to reach the treatment group outcome in terms familiar to educators — months of schooling.
The purposes of this IES-funded research project are (a) to develop academic growth references for P-12 reading and math achievement based on nationally-representative longitudinal datasets; and (b) to develop a time-indexed effect size metric, based on new national norms, that can be used to assess the effectiveness of educational interventions. Conventional effect size metrics such as Cohen’s d are standardized group mean differences based on the distributions of student outcome variables at one particular age or grade level. They do not take into account time dimension, that is, time needed to learn at that age/grade level. This study is based on the premise that time-indexed effect size metrics can estimate how long it would take for an “untreated” control group to reach the treatment group outcome in terms familiar to educators—months of schooling. They would differ from conventional grade equivalent (GE) metrics as strength-of-effect measures, which suffer from several limitations. For instance, GEs are drawn from test publishers’ norms derived from cross-sectional data of different cohort groups at a single year to estimate growth curves. Moreover, the assumption under GE that the study sample would grow at the same rate as the national norms could be erroneous. The new measures would adjust the growth trajectory based on national longitudinal data using vertical scales of achievement along with information regarding the demographic profiles of the study sample and settings.
Through a synthesis of test publisher norms and national longitudinal datasets, this study provides new national norms of academic growth in P-12 reading and math that can be used to reinterpret conventional effect sizes in time units. This study capitalizes on information from the combination of three separate test publisher norms of reading and math achievement for K-12 students: Stanford Achievement Test (SAT), TerraNova (TN), and Metropolitan Achievement Test (MAT). These all employ IRT vertical scaling methods for equating across grades and provide comparable measures of reading and math achievement across grades within tests as well as between tests. We also used three national longitudinal datasets, the Early Childhood Longitudinal Study-Birth Cohort (ECLS-B), the Early Childhood Longitudinal Study-Kindergarten (ECLS-K) and the National Education Longitudinal Study of 1988 (NELS:88) and to construct our own national norms of academic growth. These three National Center for Education Statistics (NCES) datasets provide information on a child’s academic growth along with background characteristics of the child, family, and school. The ECLS-B followed academic growth trajectories from preschool (age 4) to Kindergarten. The ECLS-K followed academic growth trajectories from Kindergarten to grade 8. The NELS tracked individual students’ academic growth from grade 8 to grade 12.
We proposed, a time-indexed effect size metric to estimate the effect size in the unit of school years/months. It serves as a supplement to conventional effect size metrics such as Cohen’s d by taking into account different amounts of time needed for learning at different age or grade levels. Through applications to Project STAR small class effects and NAEP racial achievement gaps, we demonstrate how to interpret and use d΄. Further, we applied time-indexed effect size formula to selected examples of curricular interventions in P-12 that provided information on intent-to-treat (ITT) effect sizes and met evidence standards by What Works Clearinghouse (WWC). It is expected to provide a more developmentally appropriate context for interpreting the size of an effect, a step toward bridging the gap between educational research and practice.
Research Paper Presentations and Publications
Lee, J. & Finn, J. (2010, June). Developing Time-Indexed Effect Size Metrics for K-12 Reading and Math Educational Evaluation. Poster presented at the Institute of Education Sciences (IES) annual conference, Washington, DC.
Lee, J., Finn, J. & Liu, X. (2011, April). Time-Indexed Effect Size Metric for K-12 Reading and Math Educational Evaluation. Paper presented at the annual meeting of American Educational Research Association (AERA), New Orleans, Louisiana.
Lee, J., Finn, J. & Liu, X. (2012, March). Time-Indexed Effect Size Metric for P-12 Reading and Math Program Evaluation. Poster presented at the spring conference of Society for Research on Educational Effectiveness (SREE), Washington, DC.
For quick reference, we constructed a table of conversions (see Table 2 below). Three common benchmark values of Cohen’s d (0.2 for small effect, 0.5 for medium effect and 0.8 for large effect) were converted into years/months of schooling by dividing d values by corresponding standardized yearly gain scores. We followed the same steps to construct the conversion table for demographic subgroups based on their national longitudinal growth norms.
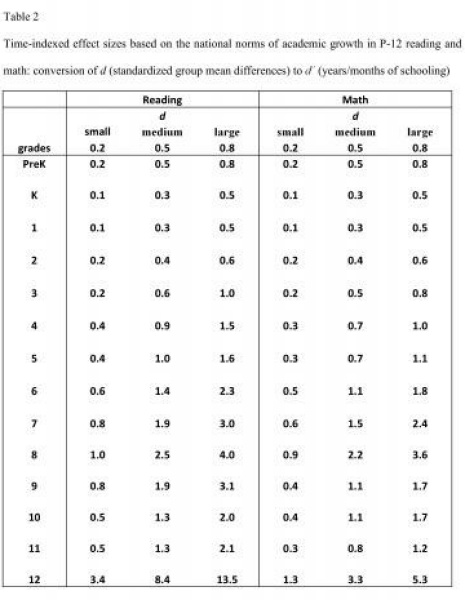
According to the conversion table for reading, the effect size for a reading program with d=0.2 (i.e., 20% of one standard deviation) in pre-K (age 4) and Kindergarten would be equivalent to two months (d΄ = 0.2) and one month of schooling (d΄ = 0.1) respectively. The same “small” effect turns into the longer time of schooling at upper grades: the effect size of .2 would become worth four months (d΄ = 0.4) in grade 4, one year in grade 8 (d΄ = 1.0), and three years plus four months (d΄= 3.4) in grade 12. For a math program with a small effect (d=0.2), the time-indexed effect size would vary from two months (d΄ = 0.2) in pre-K, one month (d΄ = 0.1) in Kindergarten, three months (d΄ = 0.3) in grade 4, nine months (d΄ = 0.9) in grade 8, and one year plus three months (d΄ = 1.3) in grade 12. For both reading and math growth norms, the time-indexed effect size tends to increase gradually over the course of schooling until grade 12.
Note of acknowledgement: This research was supported by research grant # R305D090021 from the U.S. Department of Education. The views expressed herein are solely those of the authors.